

See what's running
Every resource each component manages, with live status, browsable per install.
Get alerted on failures
Debounced alerts to Slack and webhooks, with the failing resource and the reason.
Gate your deploys
Hold a deploy open until the component has stayed healthy after the apply.
Track uptime
90 days of timeline and uptime per component and install.
Turn it on
1
Deploy, or refresh cluster access
Health checks are on for every organization. There’s nothing to install, and no agent runs in
your customers’ clusters: Nuon reads them with the same access your deploys use. An install that
hasn’t deployed recently needs one deploy to pick this up, or you can click Refresh cluster
access on the install’s health card to pick it up immediately.
2
Open the install's Resources tab
Within a minute or two you’ll see every resource each component manages, with per-resource
health, filterable by component, kind, namespace and status.
None of this requires configuration. The rest of this page covers optional settings that add to
the default checks.
What you get with no configuration
Helm chart and Kubernetes manifest components are checked automatically, about once a minute. Nuon checks standard workloads (Deployments, StatefulSets, DaemonSets, Pods, Services, PersistentVolumeClaims, Ingresses and Jobs) and the Helm release’s own status. It also checks custom resources. Nuon reads the kinds your chart or manifest ships, so aCertificate, an Issuer, a Karpenter NodePool or your own CRD is watched like anything else. A
component that starts shipping a new kind picks it up on its next deploy or drift check.
Nuon also reads Kubernetes warning events, which catch failures that never appear in an object’s own
status. For example, an Ingress whose load balancer rejected a certificate looks fine if you only read
the Ingress.
Terraform components get their cloud resources listed so you can see what a component owns. Those
rows are an inventory and don’t affect the component’s health on their own. To give a Terraform
component a health status, add a probe or a custom check.
How component health is determined
Nuon combines every resource, probe and custom check on a component into one health status. The component showshealthy when all of them are healthy. If any of them reports a problem, the component shows
that problem.
Two rules keep brief blips and missing data from sending alerts:
Health changes are debounced. Three consecutive bad observations flip a component bad; two good ones
bring it back. A single pod restart or a controller backing off doesn’t alert.
Missing data is never a failure. If observations stop for five minutes, the status becomes
unknown. It’s shown differently from a failure and never alerts.
Choosing a check
There are three ways to add your own signals. You can combine them, and most components need none of them.Probes work on every component type, including Terraform. They don’t need a Kubernetes footprint or
an action. If Nuon can reach the target over HTTP or TCP, or check it with a command, a probe is the
simplest option.
Probes
Probes check that your app is serving requests, which infrastructure status can’t tell you. A Deployment can be ready while the app inside it returns 500.httppasses on 2xx/3xx and never follows redirects.tcppasses if the port accepts a connection.execpasses on exit code 0 and reports the command’s output when it fails.
exec commands are an argv, never a shell string, and run with a minimal environment (PATH,
HOME, TMPDIR), so they can’t see the runner’s credentials. Every probe is bounded by a short
timeout and runs once per cycle.
Probe results count toward component health, alerts and history the same way as every other
observation.
Templated targets are resolved from the install’s state, so a probe pointing at a component’s own
output can’t resolve until that component has applied at least once. Until then the probe reports
unknown and says why. It stays listed and never fails a deploy.Custom checks
For anything Nuon can’t reach, such as a business metric, a queue depth or a result your CI already computed, push a custom check and it becomes part of the component’s health.status is one of healthy, degraded, unhealthy, unknown. Names are 1–100 characters of
letters, digits, dots, dashes or underscores.
A custom check can’t override Nuon’s own checks. If Nuon sees crash-looping pods, the component
stays unhealthy even when your custom check reports healthy.
A check’s last value counts for 5 minutes by default. If yours reports less often, set stale_after
(up to 60m):
unknown. It stays listed but no longer affects the component’s health.
Required checks
Use required checks when a deploy shouldn’t count as finished until something outside Nuon confirms it, such as applied migrations, a passing smoke suite or a passing canary analysis. List them by name and the deploy waits for them, the same way a GitHub branch rule waits for a required status check.unknown and only counts once it reports, so a value left
over from a previous deploy can’t satisfy the gate for this one.
Example: gate a deploy on a k6 smoke suite
Say you want no deploy to count as finished until k6 has run a smoke suite against the install and Datadog confirms error rate is within budget. Only your systems know these results, so both are custom checks, and both are listed as required.The same pattern works with anything that can make an HTTP call: a Datadog monitor webhook, a Grafana
alert, a GitHub Action, an Argo workflow step, a nightly audit job. Nuon only checks that the result
arrived after the apply and inside the window.
Alerting
Health transitions fan out through webhooks and Slack like any other Nuon event. Subscribe with a single per-resource flag:component_healthoncomponents: sends both failures and recoveries, so a channel that gets a failure alert also gets the recovery.install_degradedoninstalls: fires when the install-level rollup changes. You usually don’t need this too. When a component’s failure is what moved the install, the component alert reports both in one message.
install degraded and an Install health field shows
healthy → degraded. You don’t get a separate install message.
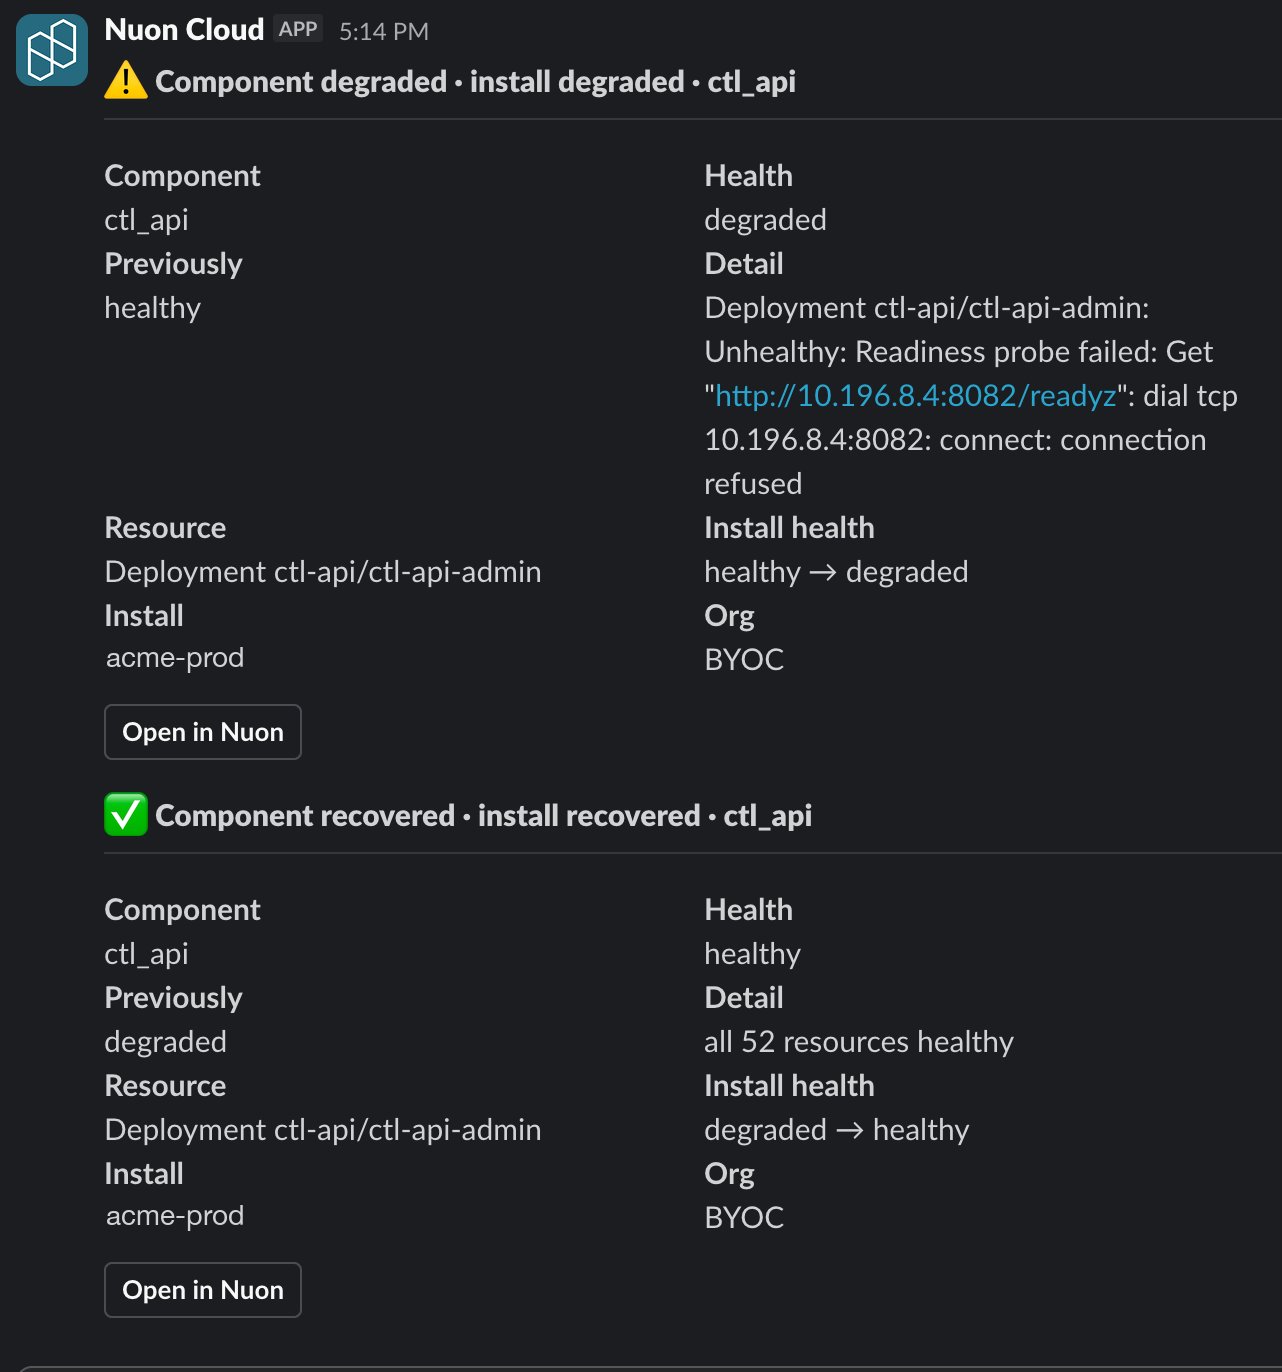
A component degrading and recovering, delivered to Slack.
unknownnever alerts. A runner going offline is already reported as runner inactivity, and would otherwise page you once per component.- Only root causes alert. When a component fails because something it depends on failed, the
dependents are labelled
downstream of <component>and don’t alert. - Recoveries are always paired with the failure that preceded them.
Verified deploys
By default a deploy finishes when the apply succeeds. Setblock_deploy and it finishes only once
the component has held healthy for stabilization_window afterwards.
Canary and bake periods
You can build canary rollouts from these pieces, starting with a fleet health summary filtered by install label:tier=canary, hold until all_healthy has stayed true for your bake
period, then continue to the rest of the fleet.
all_healthy is true only if at least one install was evaluated. Installs that have never been
evaluated are counted separately in unset, so a rollout script can’t treat missing data as a pass.
Uptime and incidents
Every debounced transition is kept for 90 days, giving each component and install a timeline and an uptime percentage, drawn as status-page-style daily bars. The badge shows current health, and the percentage covers the last 90 days. A component showingHealthy at 97.57% is fine now but had problems earlier. An install is degraded whenever any of its
components is, so in the example below that component sets the install’s uptime.
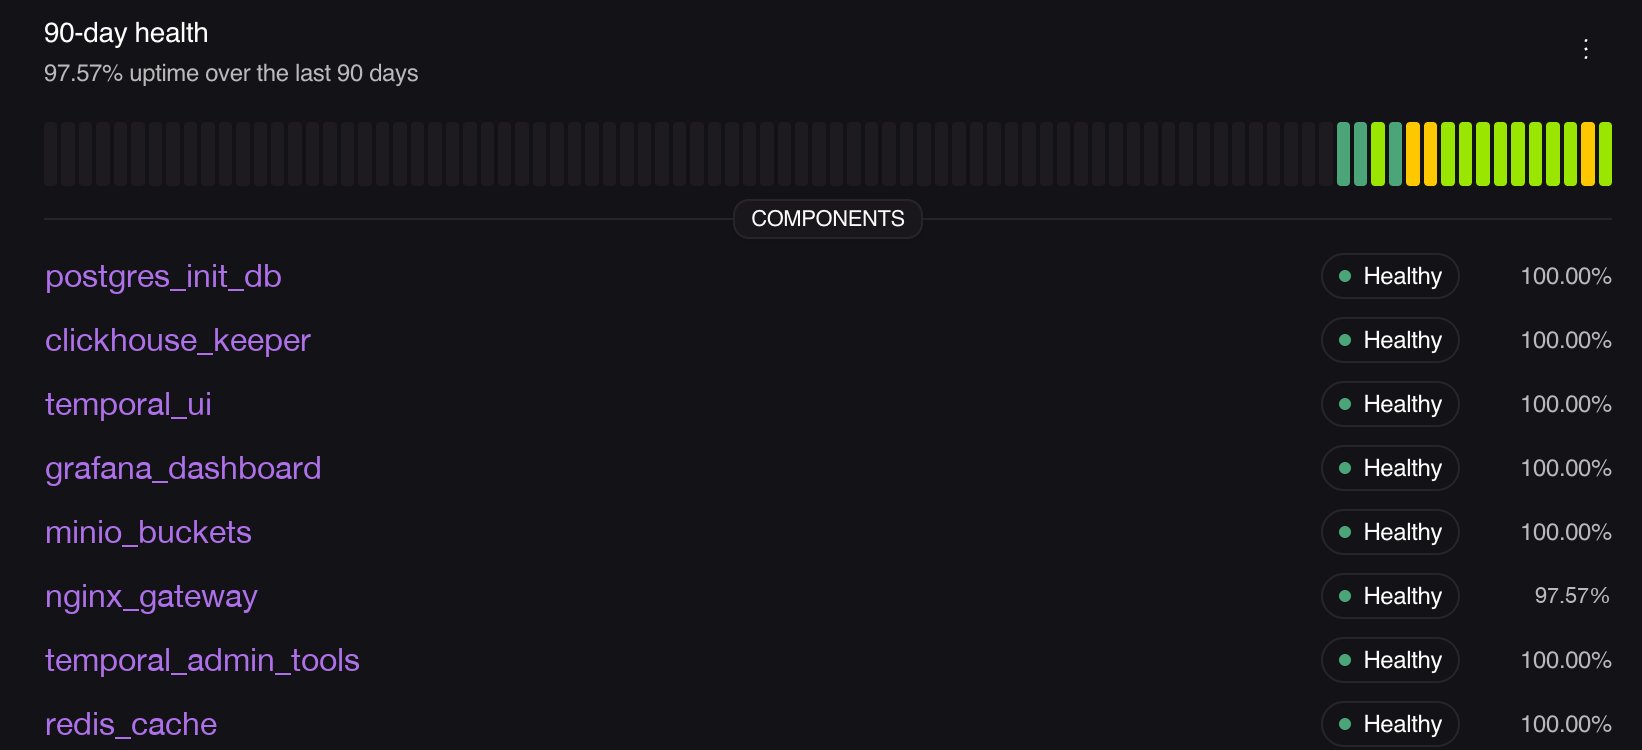
90-day health for an install, with per-component uptime.
unknown is excluded from uptime and counts as neither up nor down. An install with no
observations reports zero observed time instead of 100%.
Each component also has an incident bundle that collects the failing transition, the captured
diagnosis (Kubernetes events, restart counts, termination reasons like OOMKilled) and the deploy it
followed. You can pass it to a runbook or an agent as input.
Troubleshooting
Everything shows unknown or no resources at all
Everything shows unknown or no resources at all
Nuon can’t reach the cluster, usually because the install hasn’t deployed recently.
Click Refresh cluster access on the install’s health card, or run any deploy. Resources
should appear within a minute or two.
A component shows a dash instead of a health status
A component shows a dash instead of a health status
That’s
not-applicable. Either the component has no observable runtime footprint (a Terraform
component with no probe, a build-only component), or it has never deployed. Add a
probe or a custom check to give it a health status.My custom resources aren't listed
My custom resources aren't listed
Kinds are read from what your chart or manifest ships, and are picked up on deploy. If you’ve
just added a CRD, deploy the component once, or wait for its next drift check, which
also refreshes them without applying anything.
A custom check went unknown on its own
A custom check went unknown on its own
Its window expired. Set
stale_after to match how often you report, up to 60m.Health took a few minutes to change
Health took a few minutes to change
That’s the debounce: three bad observations to flip, two good to recover, at roughly one
observation a minute. It keeps a single restart from sending an alert.
My deploy failed on a required check that did run
My deploy failed on a required check that did run
It has to be pushed after the apply finishes, and be healthy when the window closes. A value
pushed before the deploy started doesn’t count for that deploy.